Augur Infinity
A picture is worth a thousand words. Infinity is an AI-powered financial analytics and visualization platform for data-driven investors.
The Augur Difference
We are your trusted data and analytics partner
We are not just another macro data aggregator
While we provide all the macro data you’d expect, we also calculate a
large suite of proprietary indicators. That includes
daily growth and inflation nowcasts for more countries than anyone else,
constant maturity yield curves for the largest number of countries, etc.
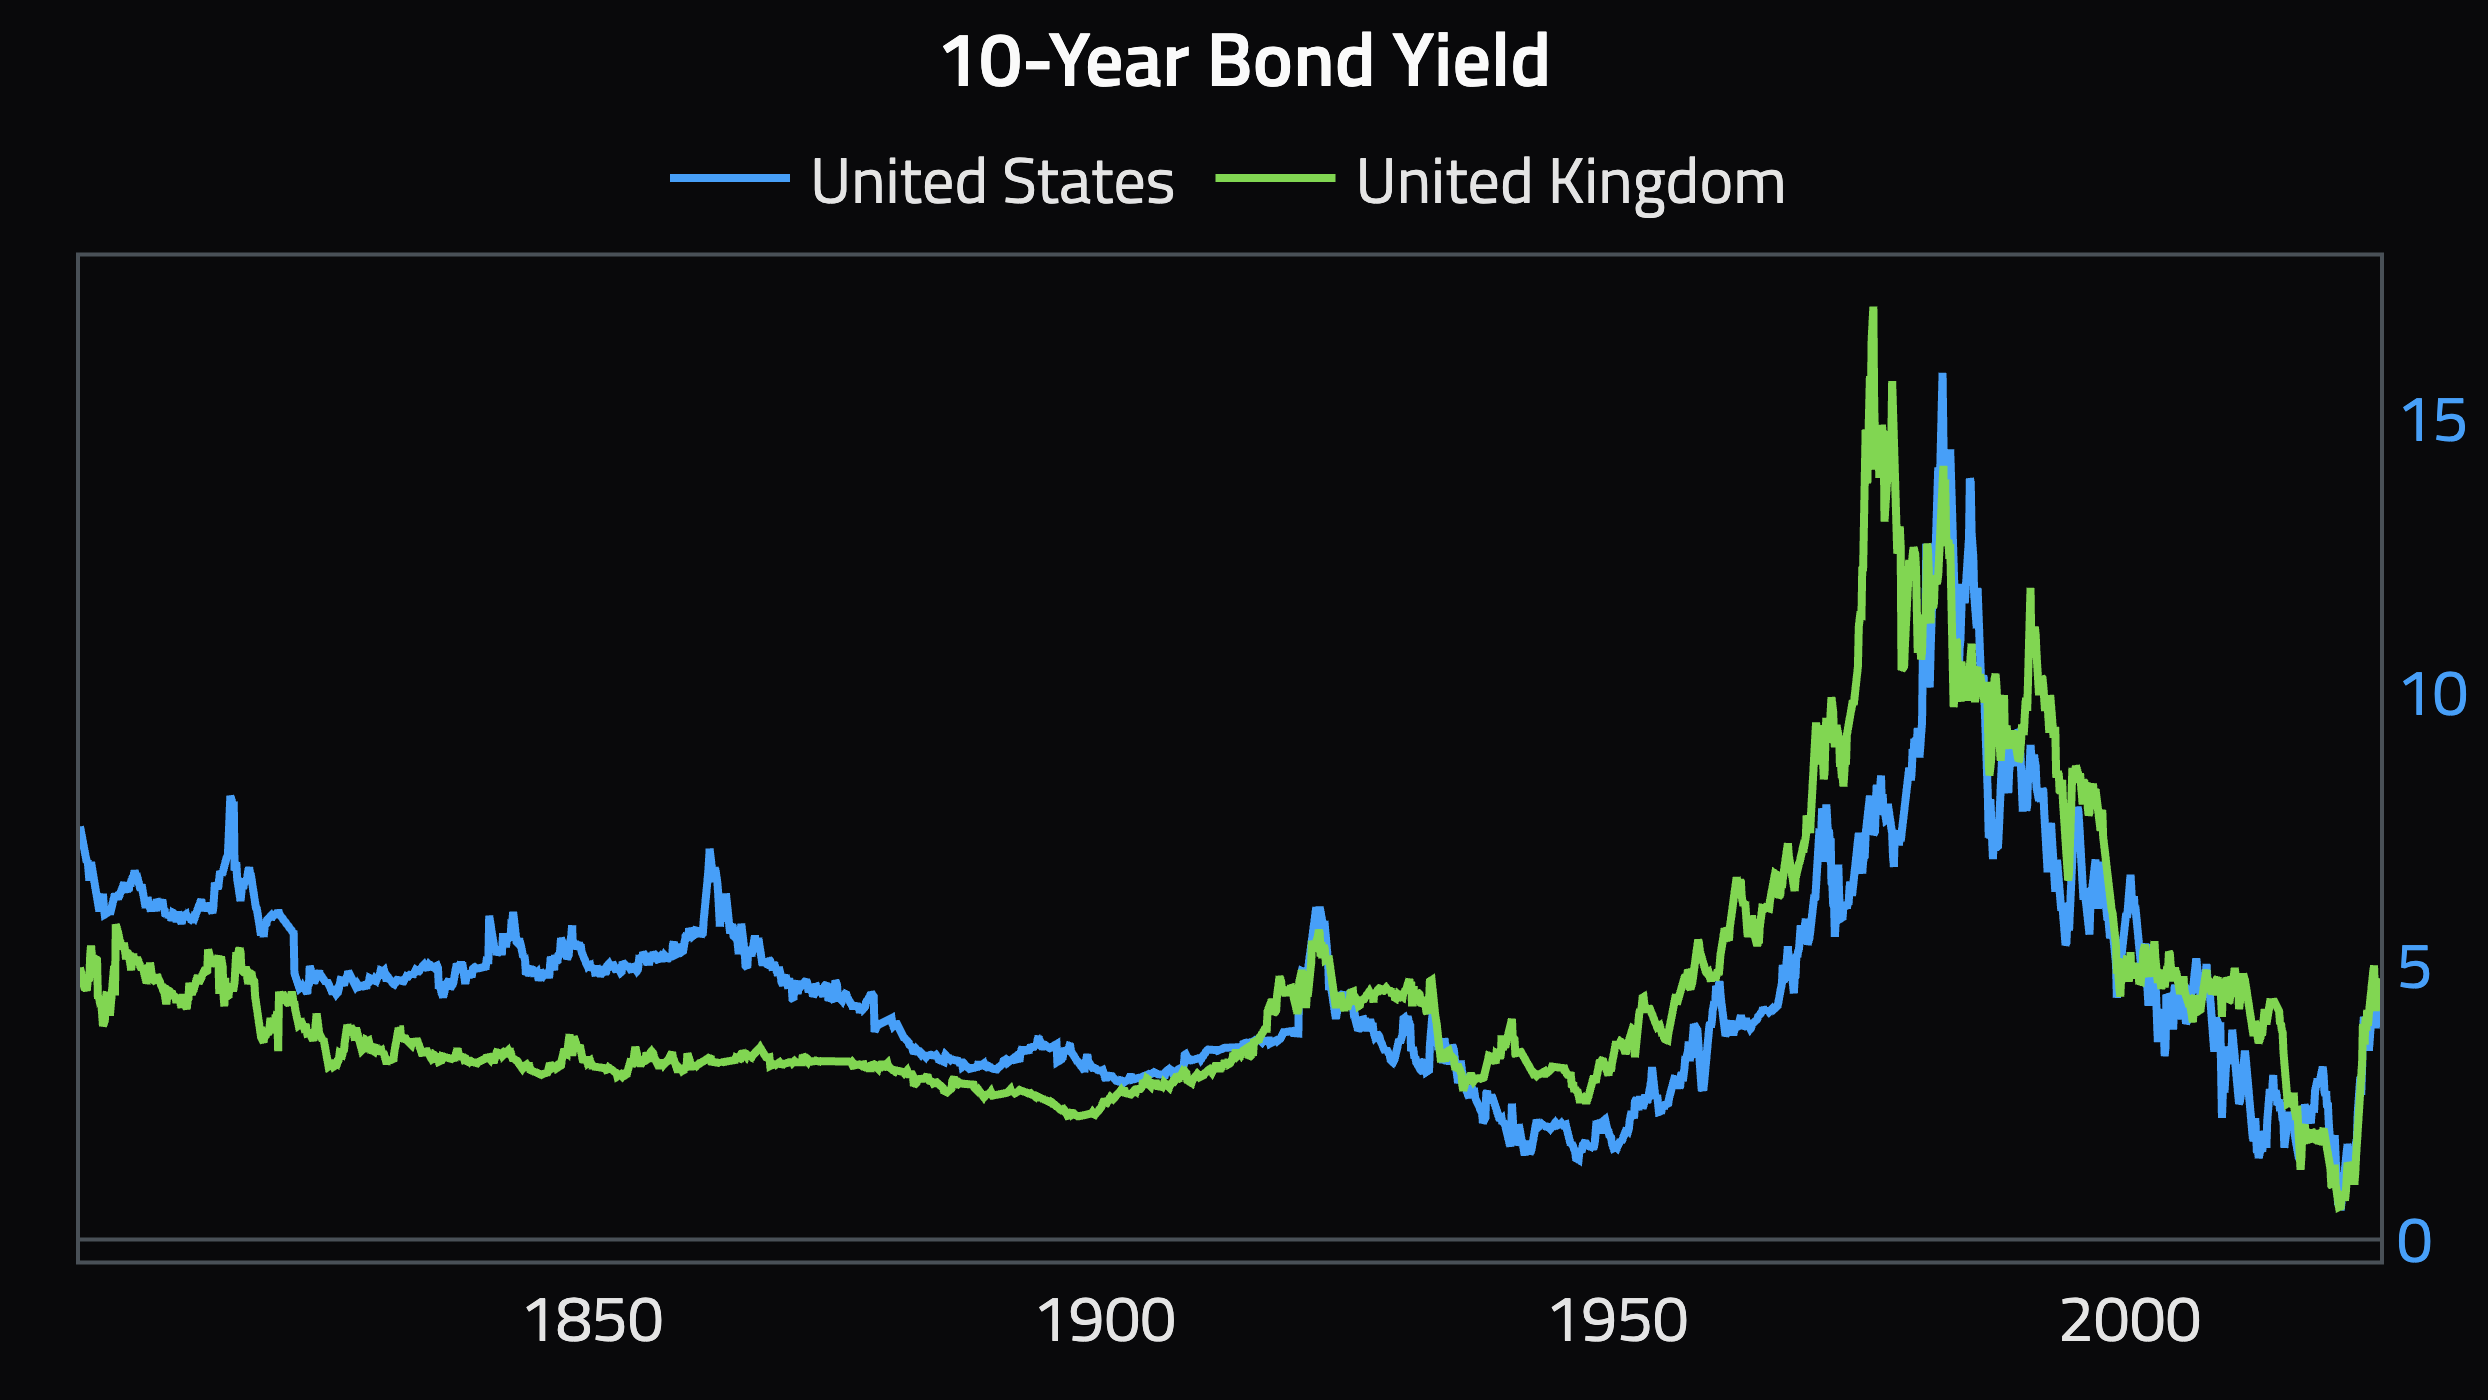
We also specialize in digitizing hard-to-find ultra-long-term data going back centuries.
We provide fully customized visuals
Our goal is to empower you to create professional, beautiful, and
consistent visuals as if they were created by a dedicated graphics
department. We create fully customized templates for every
enterprise client, so charts created using Infinity blend perfectly
into your existing documents and slides.
We have deep domain expertise in our datasets
We collect, cleanse, and pre-process all the core economic data
ourselves, allowing us to provide you with the highest quality data
ready for analytical purposes. Further, we have deep domain
expertise in our datasets, allowing us to have deep conversations
with our clients on the best way to interpret and utilize the data.
Our support goes far beyond what’s already on Infinity
Need to work on a dataset we don’t have yet? Simply submit a data
request. We fulfill most data requests on the same day, sometimes in
minutes, a track record unmatched in the industry. Our client
commitment goes beyond data. Have charts that you are struggling to
create? Our specialists will help you build and format the charts to
your precise specifications.
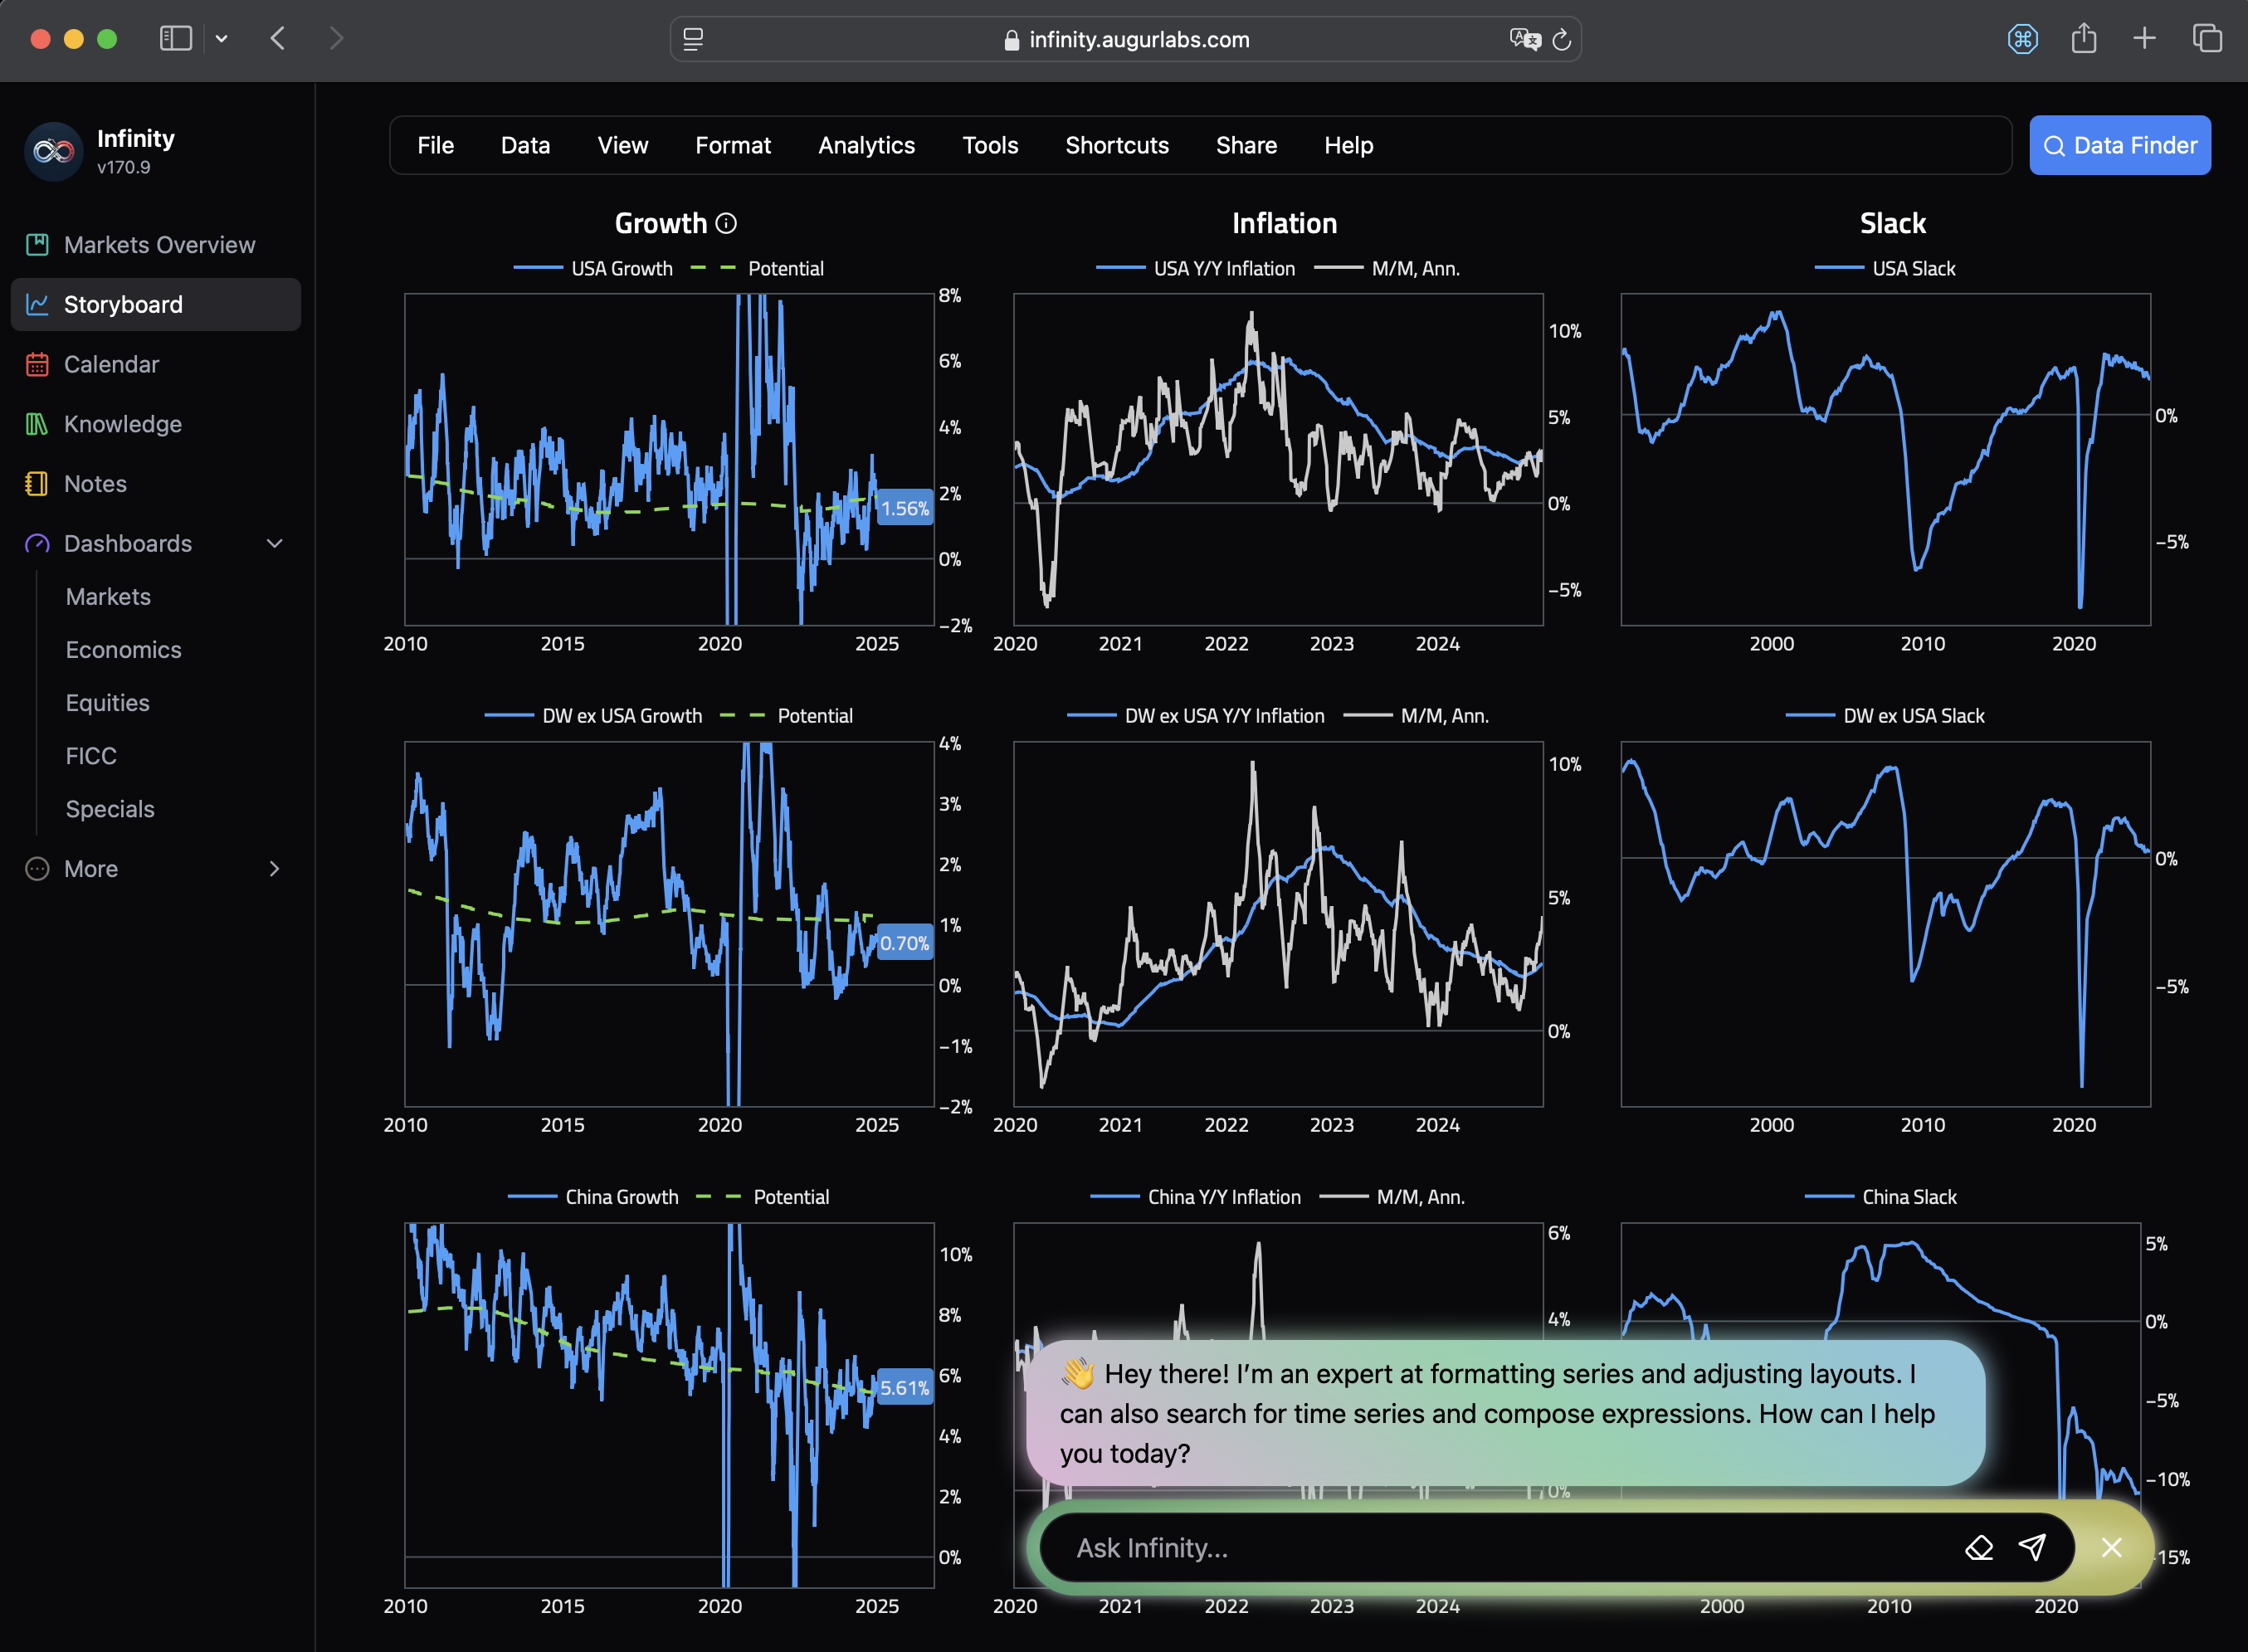
Powered by AI
Perform complex analytics with natural language.
Say goodbye to instruction manuals
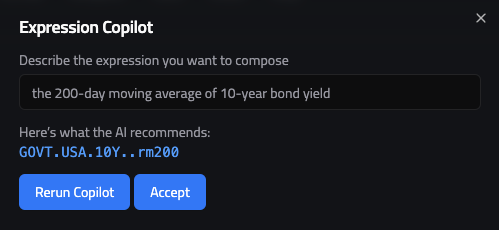
Infinity’s AI, powered by Large Language Models, can help you find
data, compose expressions to perform complex time series analytics,
create elaborate chart layouts, and much more.
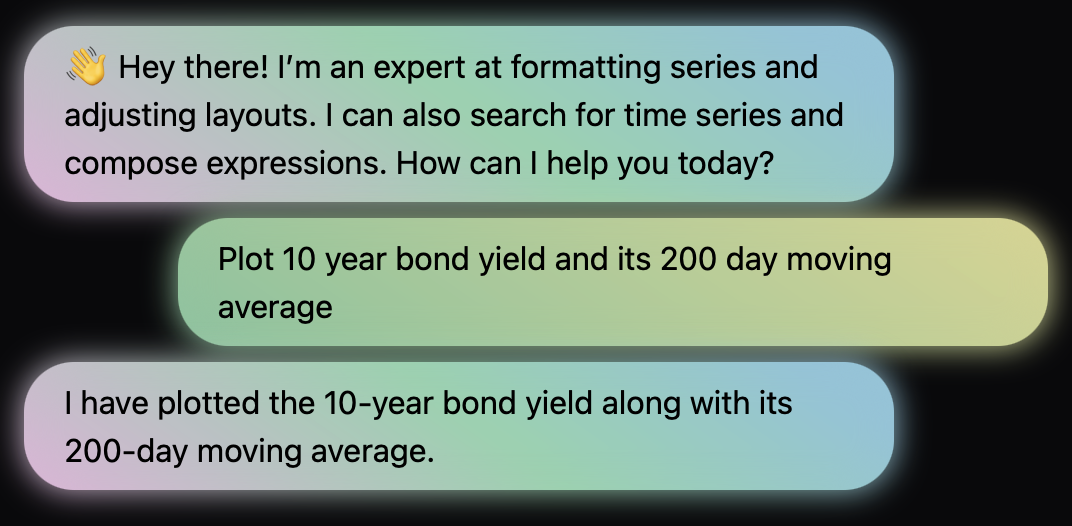
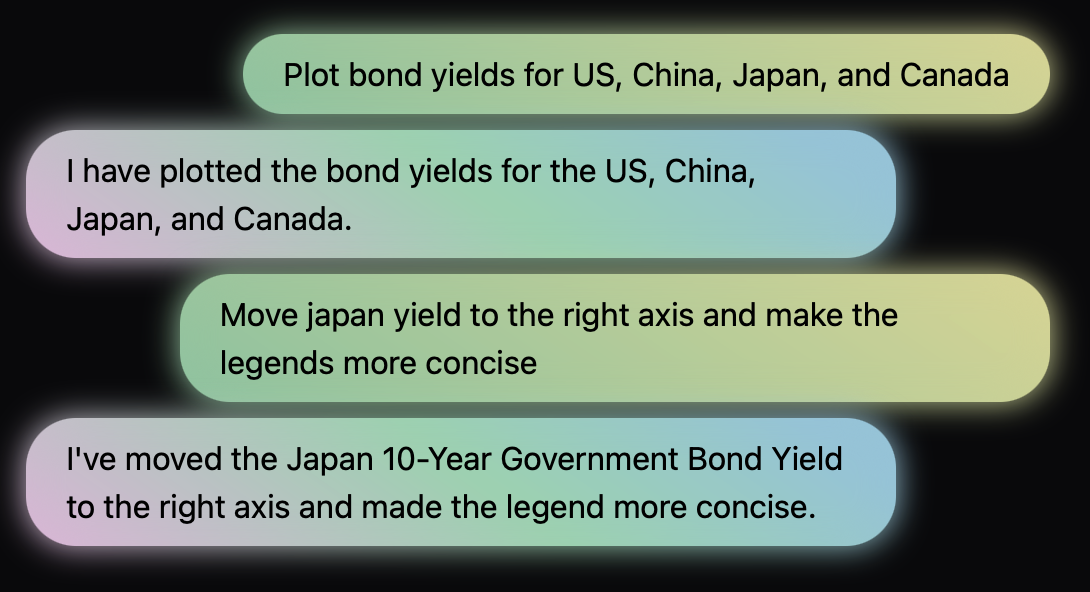
Elevate your productivity
Achieve multiple steps with a single statement, such as “plot the CPI
for both Australia and Canada on two y-axes.” Our AI also remembers
everything it has done, allowing you to incrementally build out
complex analytics.
Data for 200 countries, ready to roll
Clean, long-term & actionable data at your fingertip
Depth + Length
Economic data for 200 countries, going back centuries. Market data for
equities, fixed income, foreign exchange, commodities, alternative
risk premium, crypto, even OTC derivatives. The size of the database
does matter.
Ready to Use
Infinity’s data has been cleaned, stitched, and pre-processed by
domain experts, so you can focus on analyzing the data.
Data You Won't Find Elsewhere
Unique datasets we have painstakingly assembled, such as constant
maturity bond yields for the US since 1918, US core inflation since
1901, and FX rates going back a century.

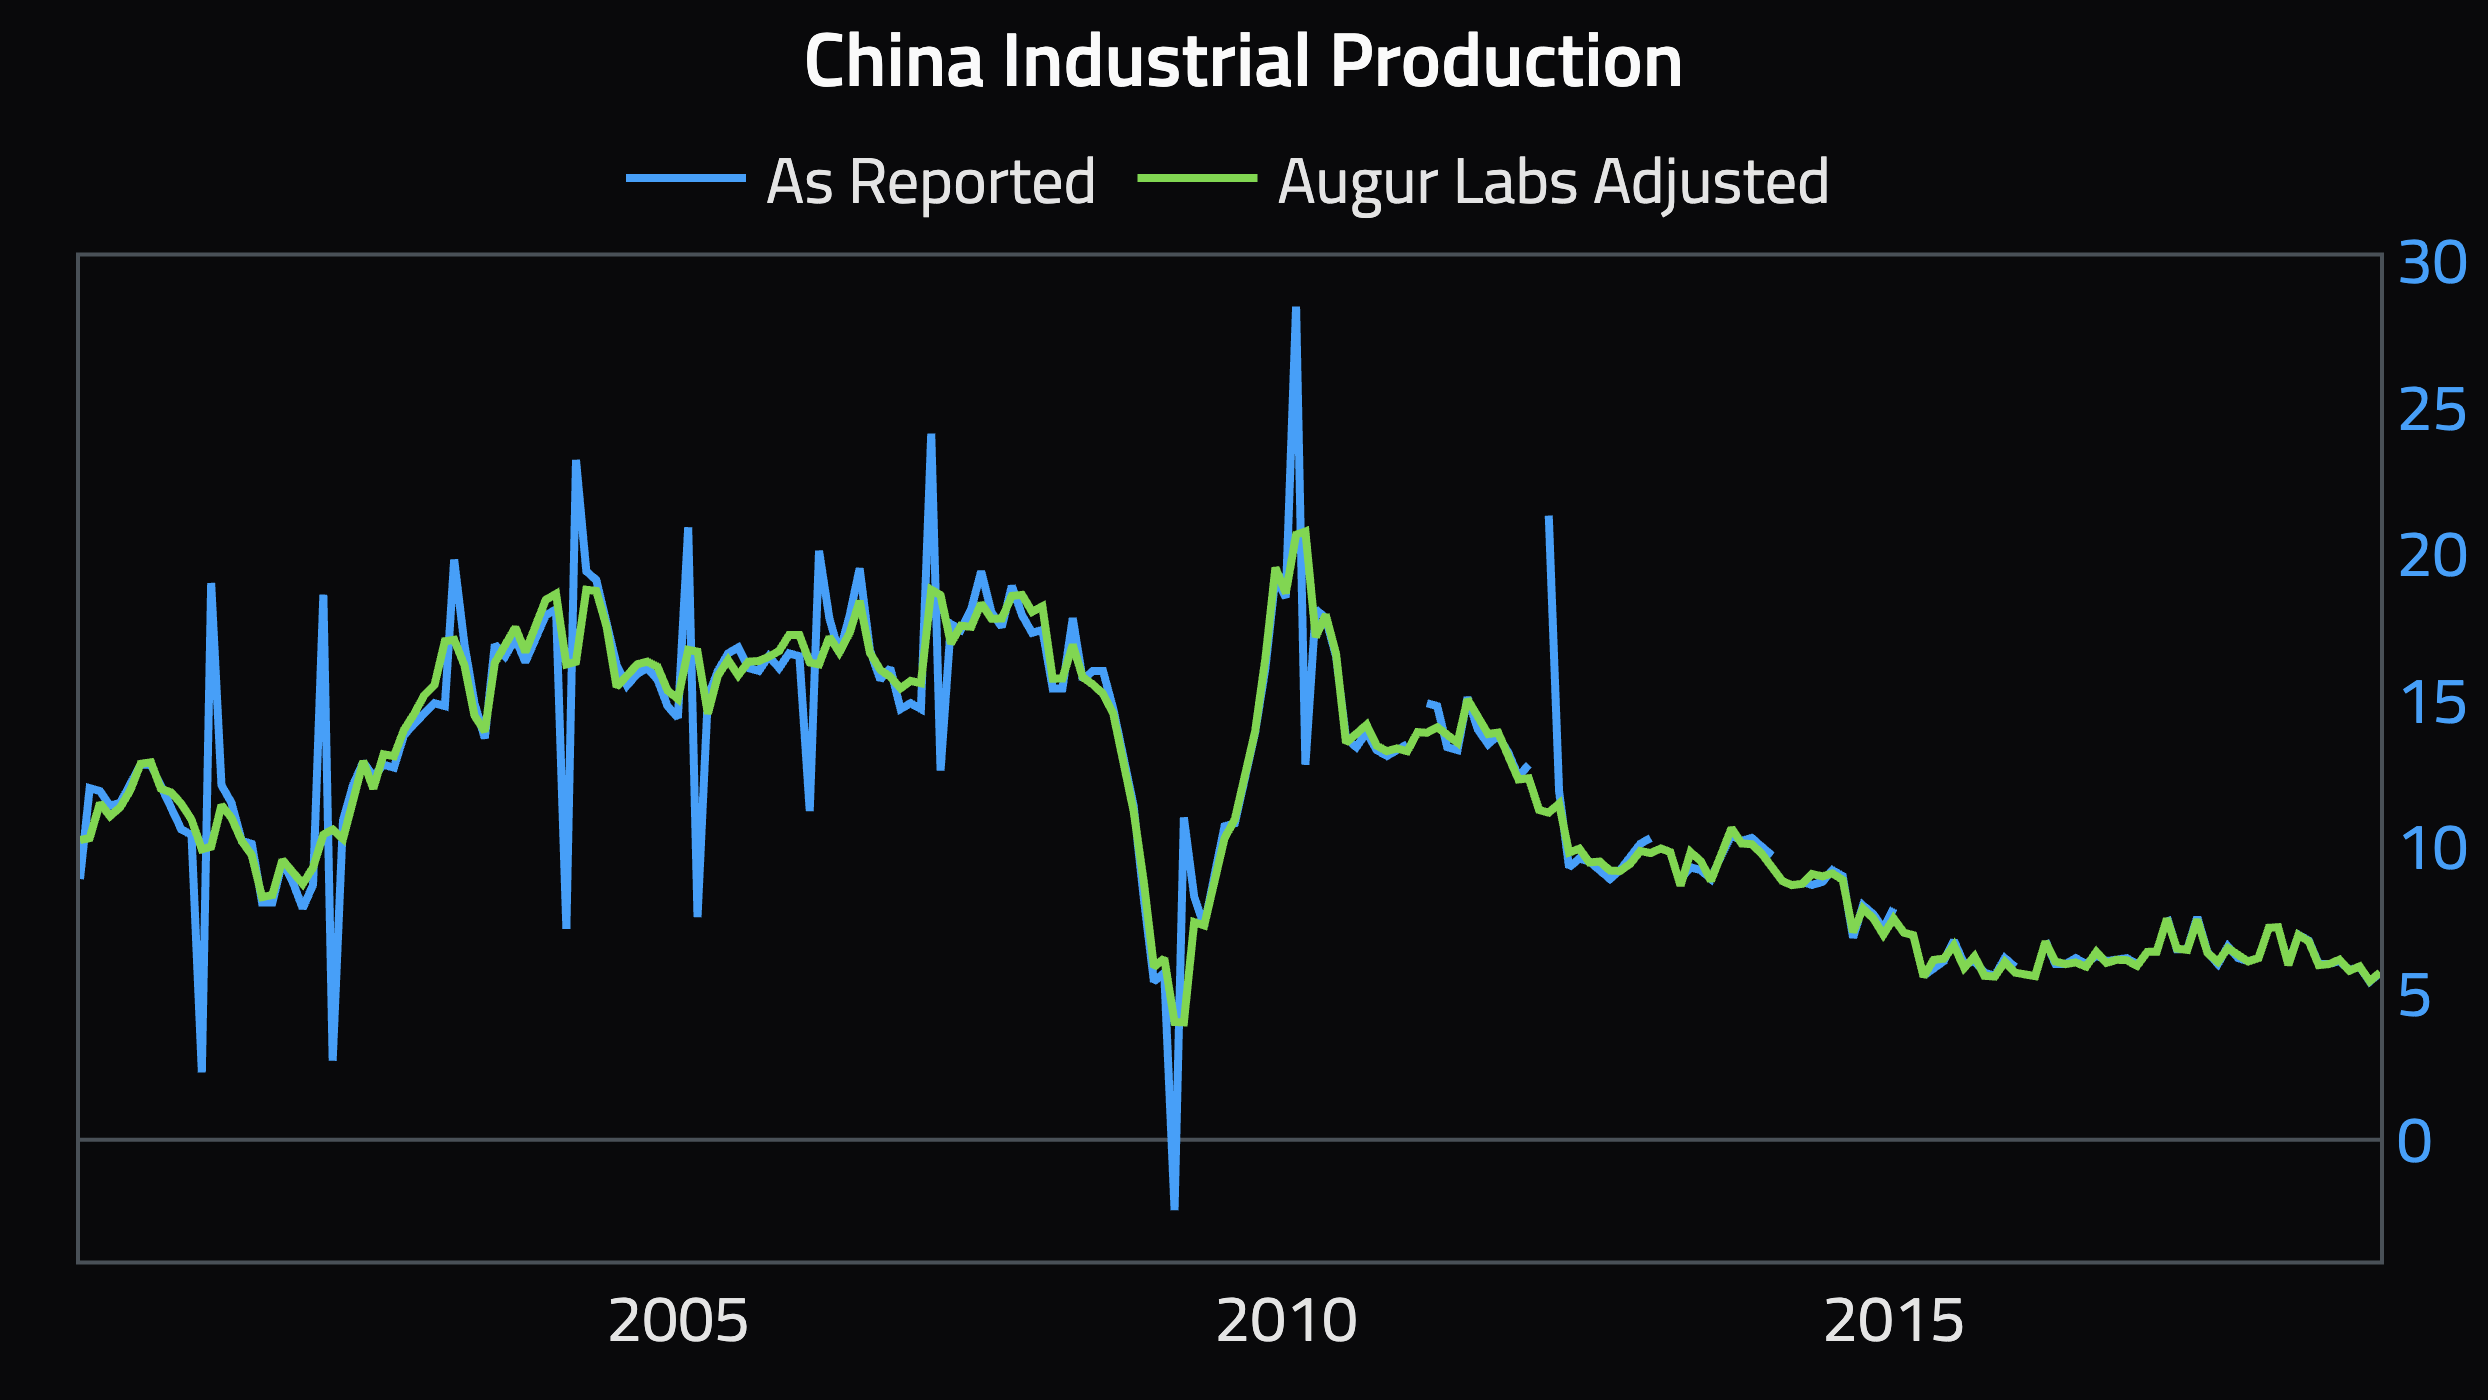
Proprietary Indicators to Help You Navigate the Markets
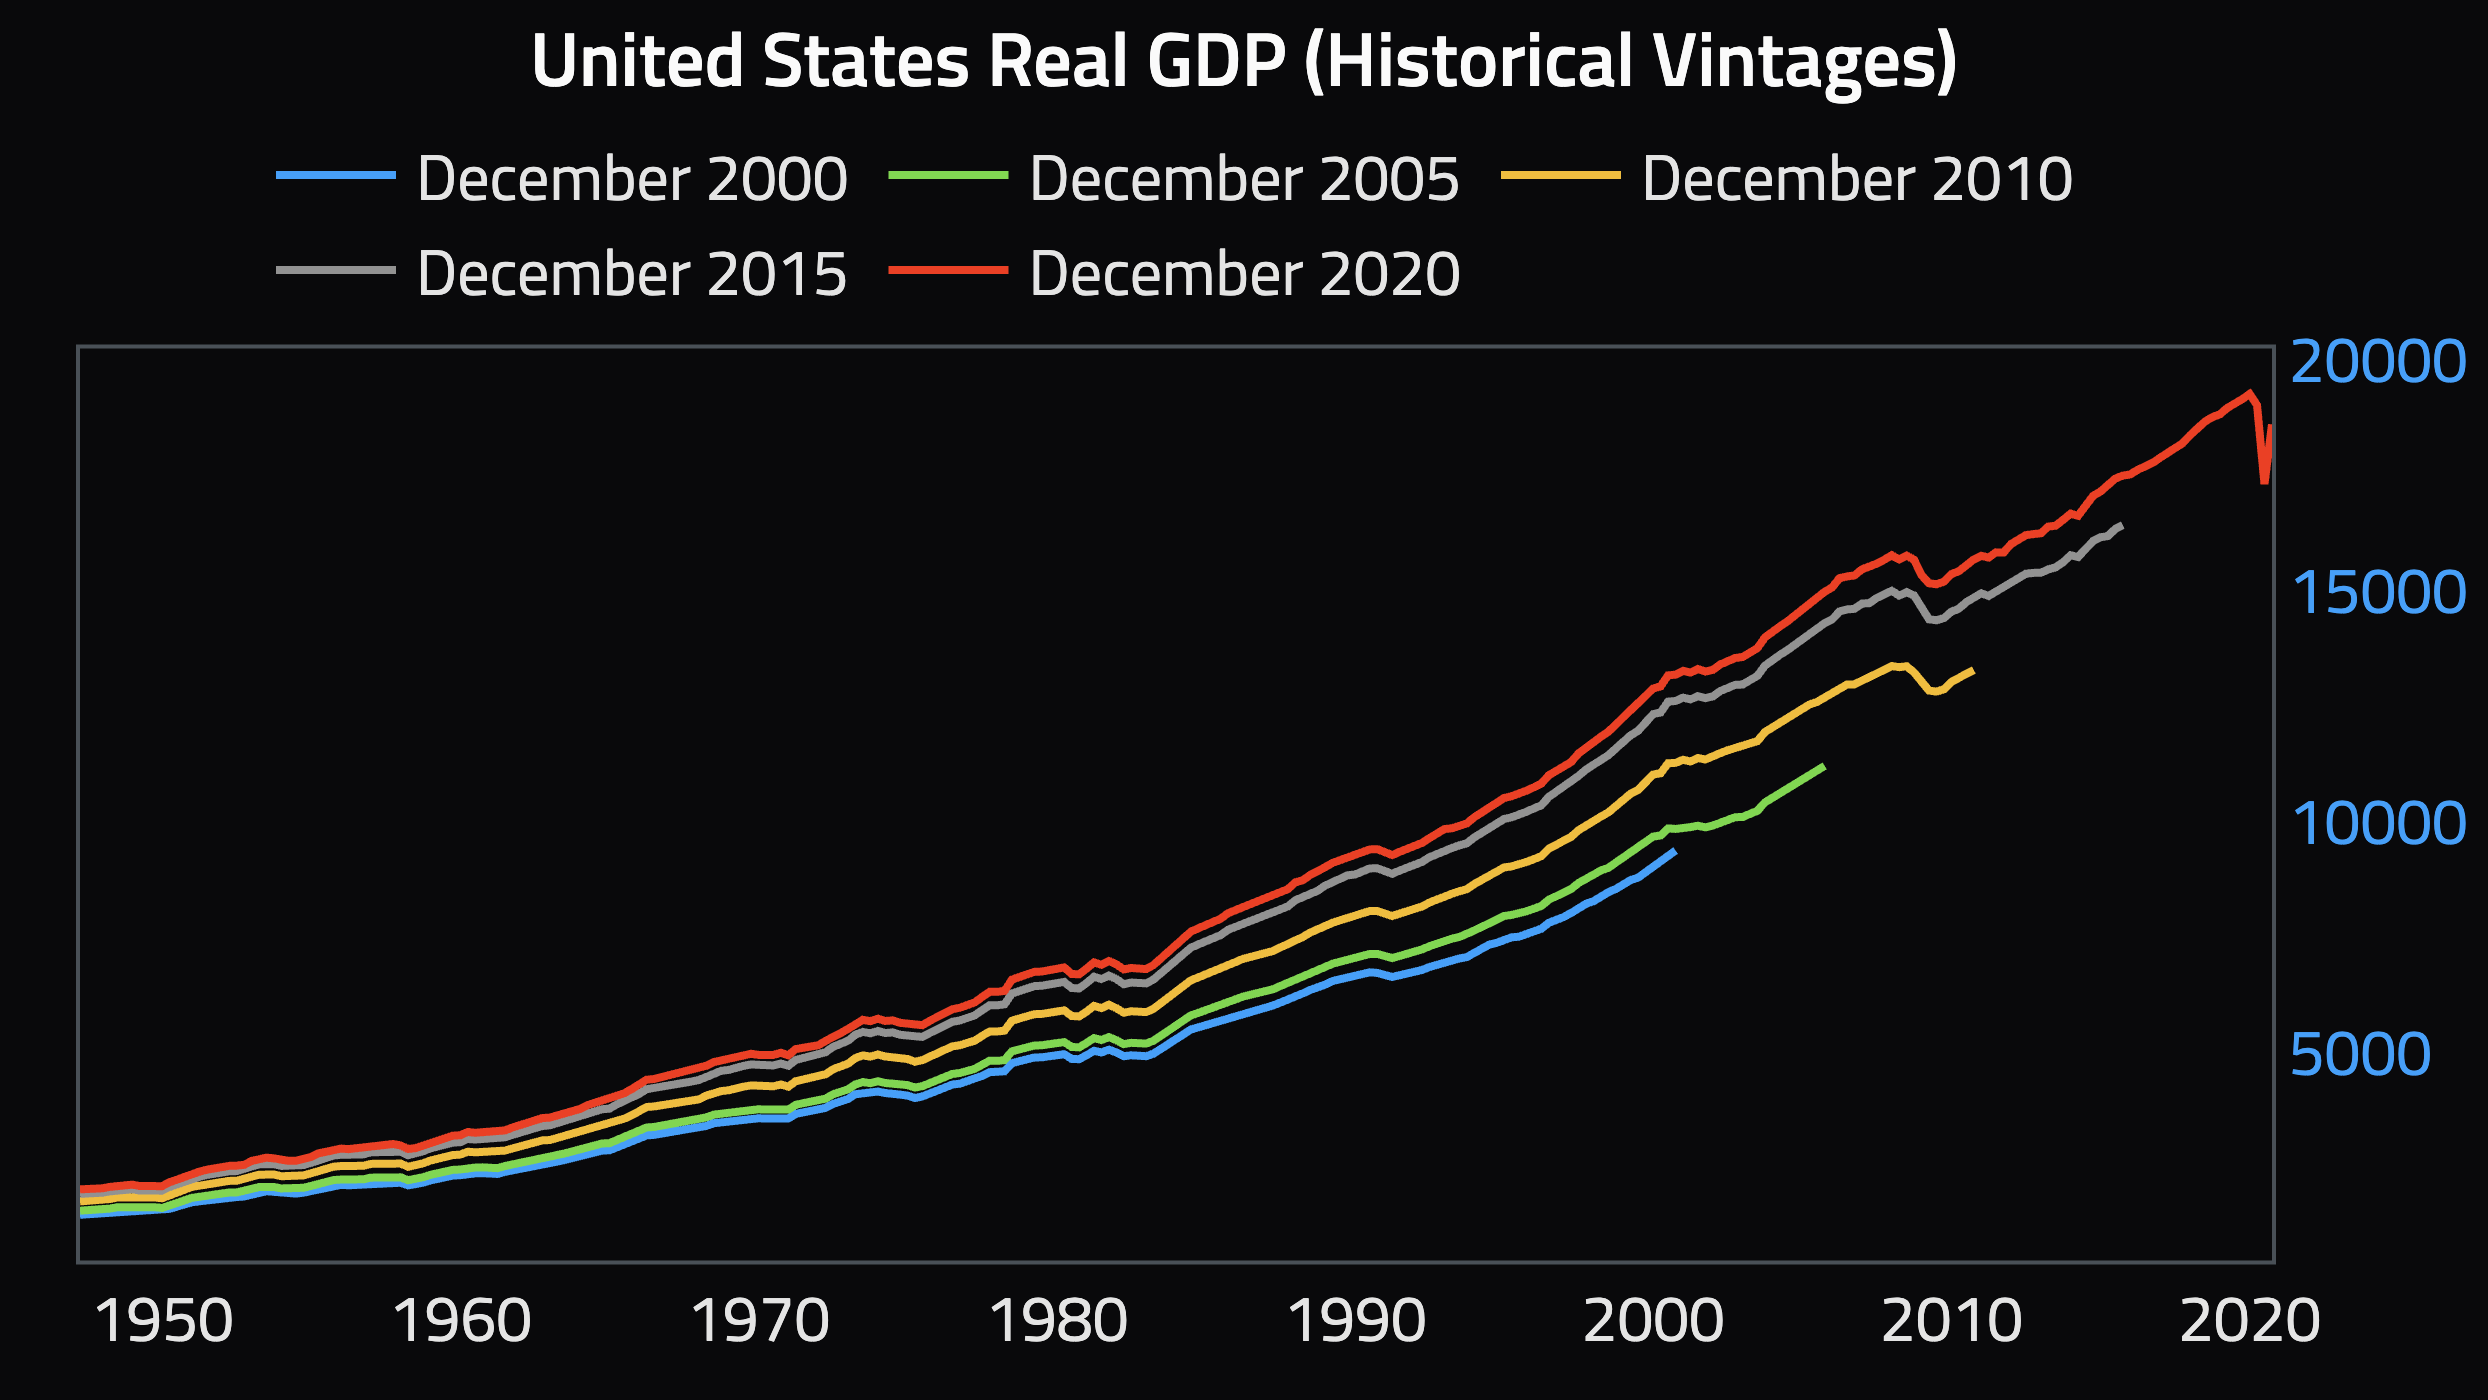
Vintage Point-in-Time Data
Unrevised, point-in-time data for numerous indicators, giving you
confidence that your analyses and backtests have no look-ahead biases.
On-Demand Data
Need to work on a dataset we don’t have yet? Simply submit a data
request. We fulfill most data requests on the same day, sometimes in
minutes, a track record unmatched in the industry.
Complex visuals made simple
Tell powerful stories with expressive charts, fast
Production quality visuals without the effort
Create beautiful visuals that look like they are prepared by a
professional graphics department, effortlessly. Plus, everything on
Infinity is fast and responsive, supercharging your productivity.
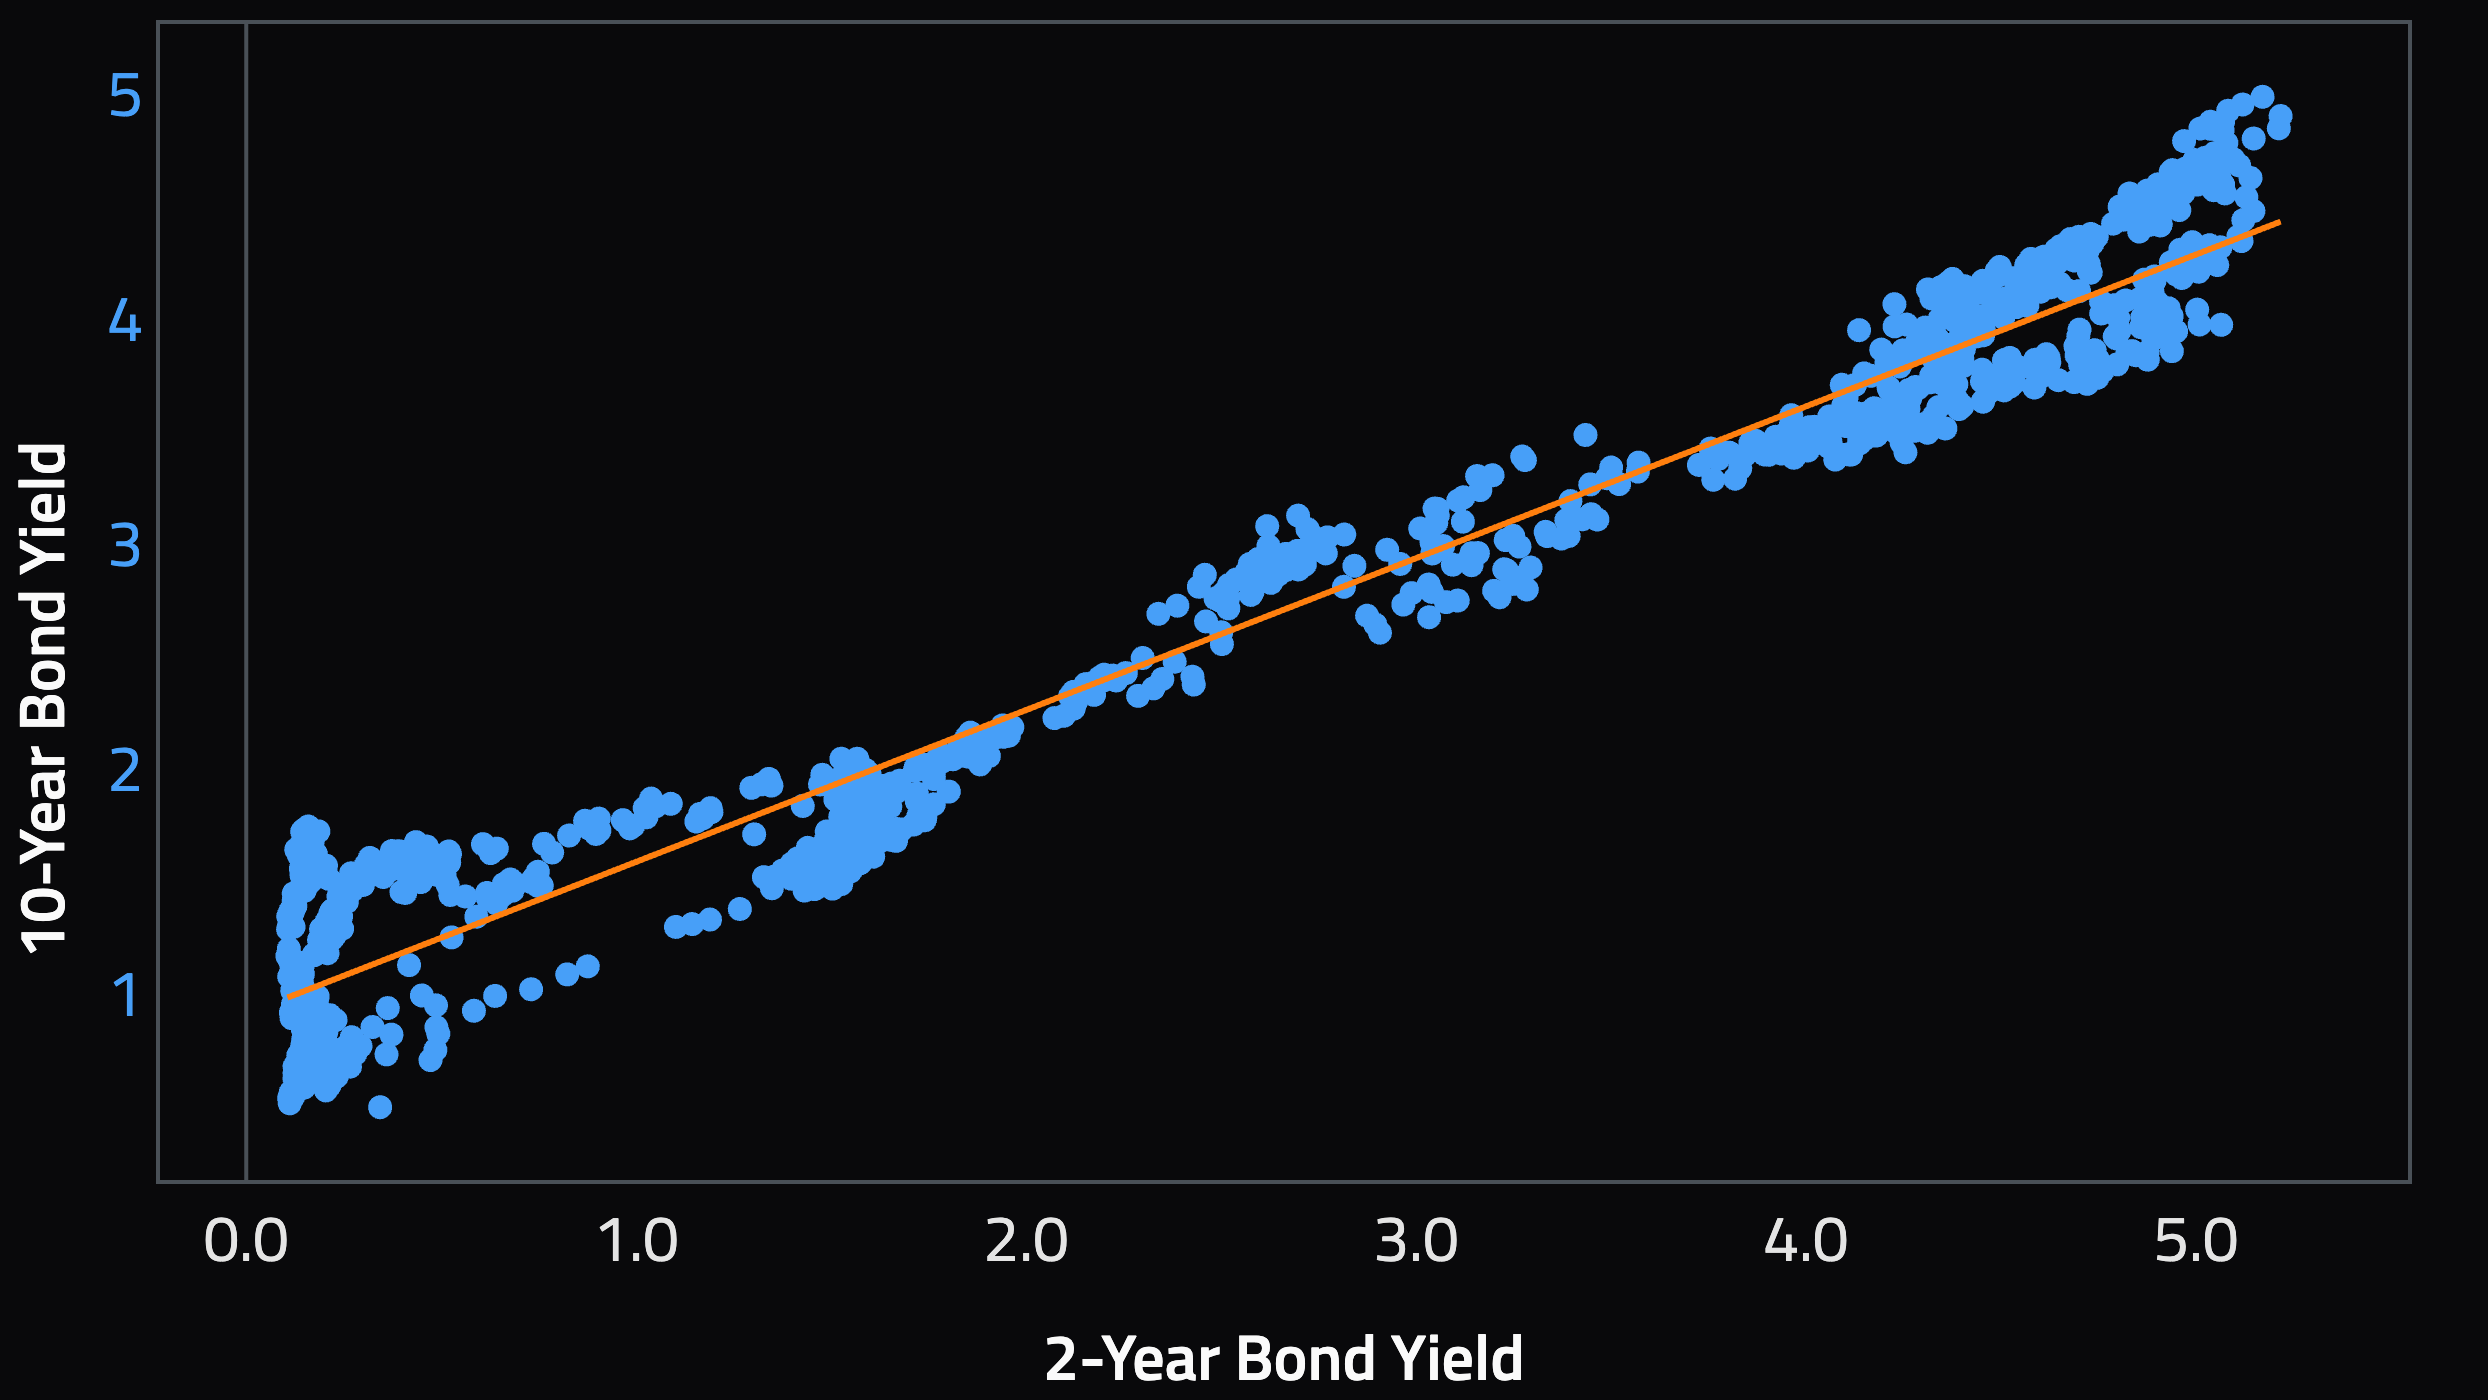
Numerous chart types
From simple line charts to complex statistical charts such as box
plots, or even the Fed's dot plots. Everything is just one click
away.

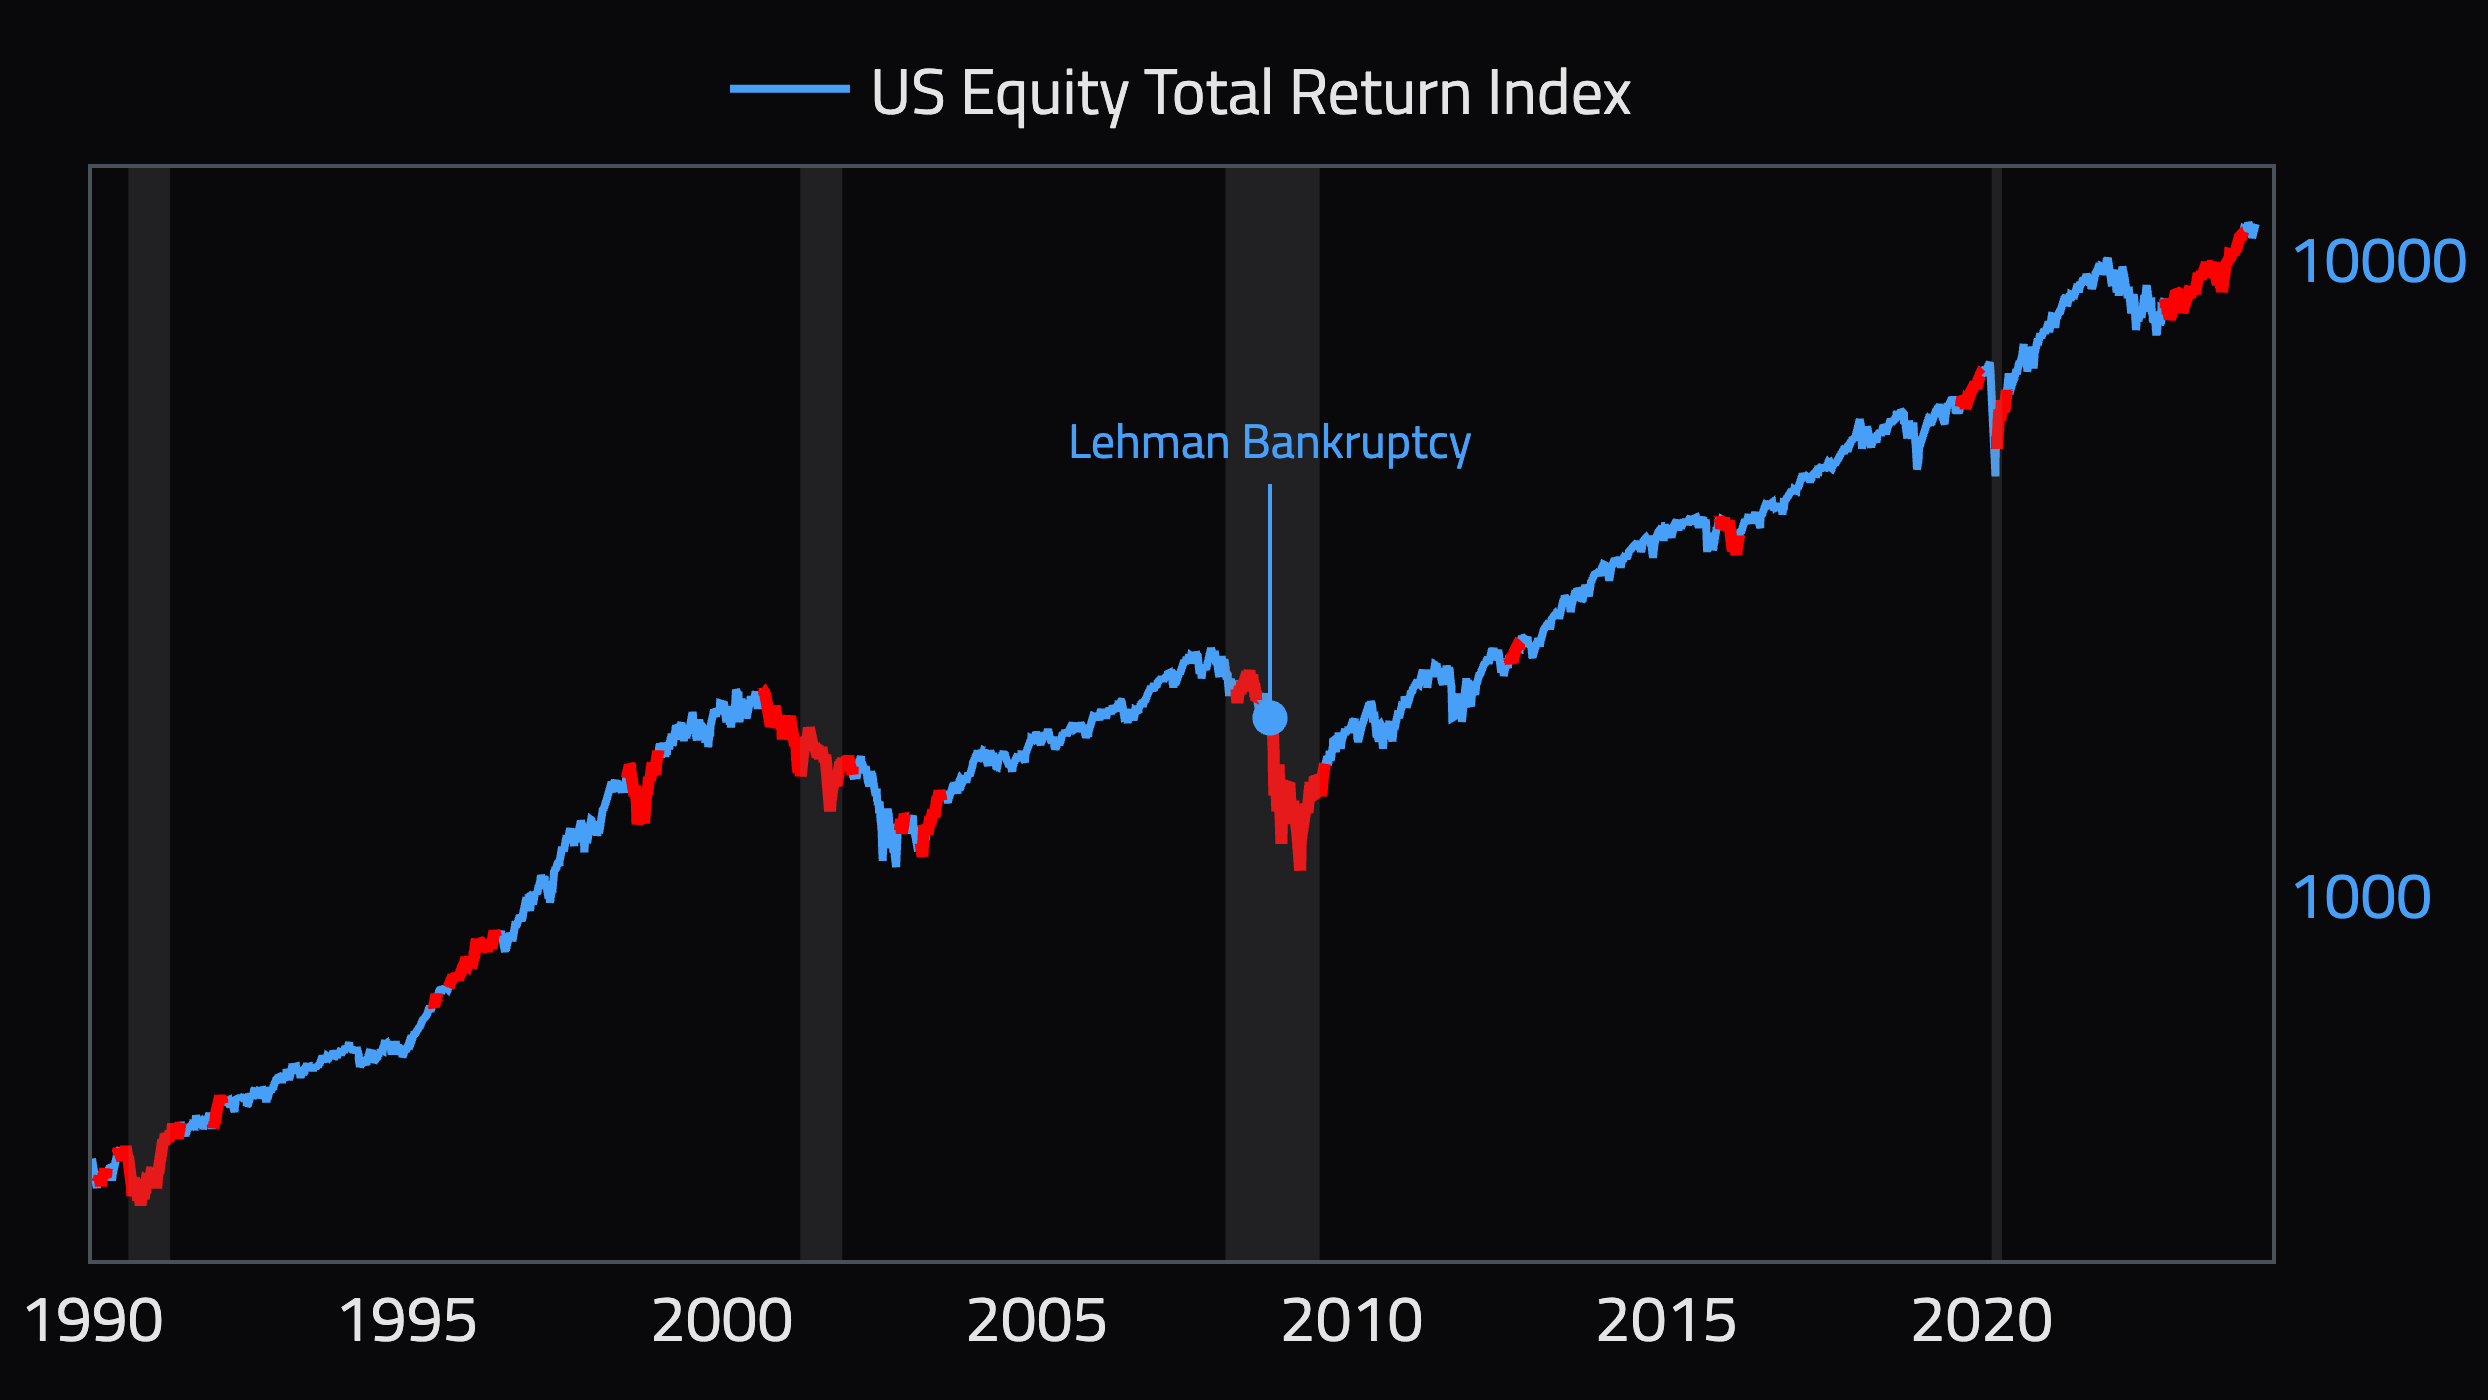
Annotations
Annotate key events, or shade recessions and bear markets, with ease
and style.
Interactive Storyboards & Canvases
Build rich Storyboards with up to 50 panels on a single page, and
combine a collection of Storyboards into an interactive canvas. Point
and click; no programmers needed.
Recycle & Reuse
Infinity’s innovative “parameterized storyboards” let you recycle charts
like no other. Build a chart for one country, and an automagically
created toggle lets you use it for other countries with zero work.
Advanced analytics in seconds
Super quant powers at your command
Instant Codes
Using advanced data science techniques is now easier than running
regressions. Instantly apply the most complex time series analytics
to your data with just a few keystrokes. Even better, the Infinity
AI can help you compose these codes using natural language!
Analogs
“What typically happens after the Fed raises rates?” Wonder no more.
Construct analogs to answer these questions in a minute or two. See
both the likely path forward and the range of outcomes.

Python Savvy
Python is Infinity’s native tongue. Perform even more advanced analytics
and strategy backtests with built-in support for NumPy and Pandas. No
need to learn another proprietary language.